
Wellington City Council | A3 and design work
The impact of investment in services to support people experiencing homelessness (2023)
We tell your story and communicate your message effectively using clever and useful design. We design infographics and diagrams to bring your data to life using clear and captivating design skills.
FrankAdvice presented the results of our review of Wellington City Council’s investments in programmes and services to support people experiencing homelessness to Council. See case study here. To support this presentation, we prepared a summary A3 handout of our report.
This A3 provided:
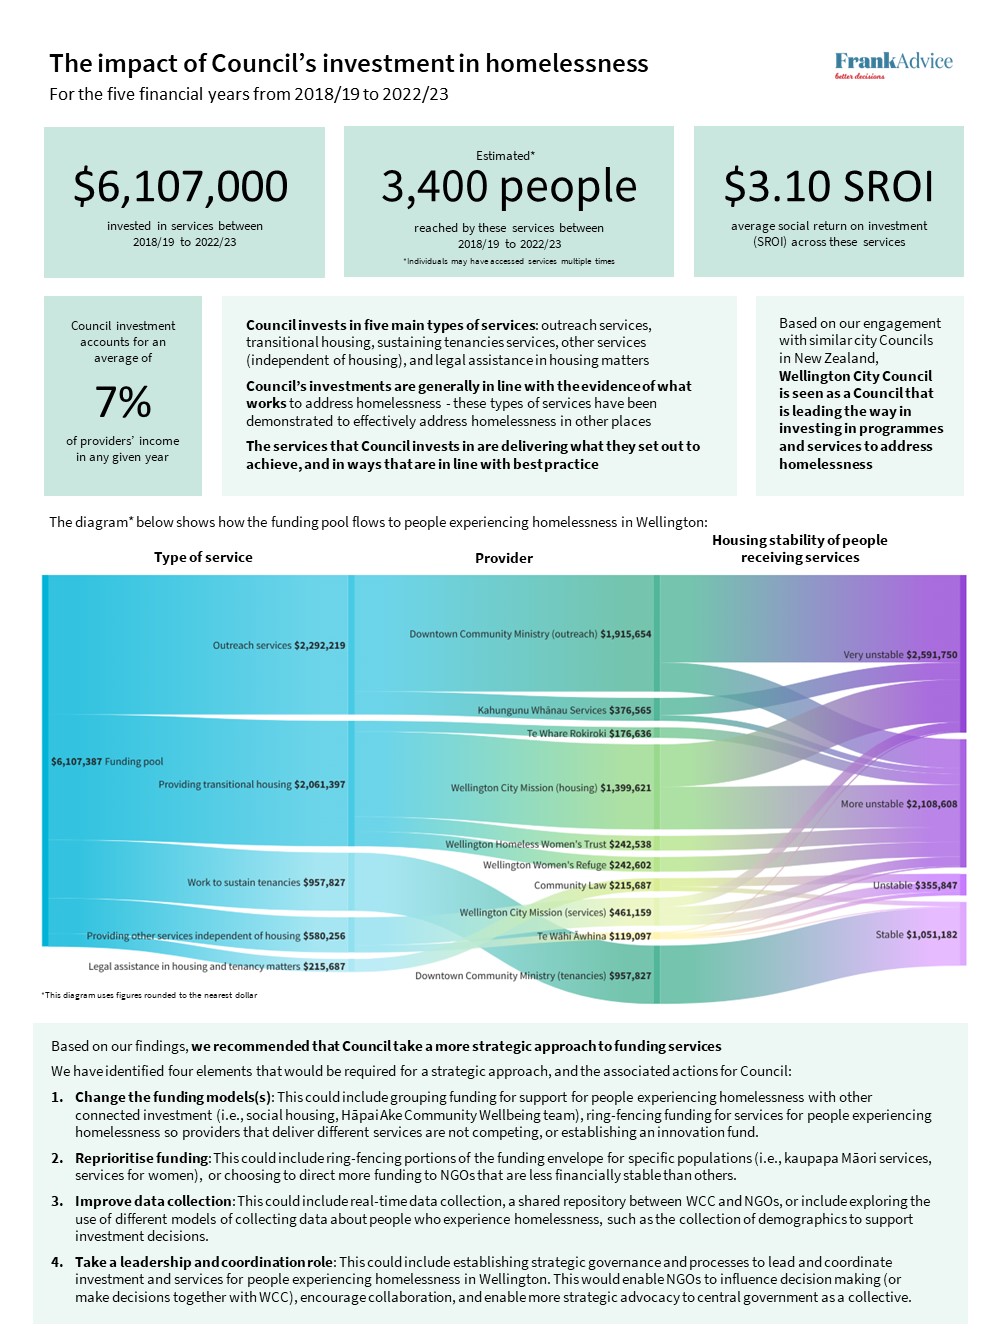
- the highlights of our findings
- a summary graphic of the Council’s investment flows
- our key recommendations.
The highlights of our findings appear as boxes across the top with large text to draw the reader’s eye, with explanatory paragraphs in lighter-coloured boxes to not clutter up the page.
The summary graphic is a Sankey diagram that shows how the Council’s funding pool is allocated across services, who provides those services, and who those services reach, allowing the reader to “follow the money” from Council spend to the individuals affected. It is positioned in the middle of the page with brighter colours because it was likely to be the primary focus of our presentation.
Finally, our key recommendations appear in the same lighter-coloured box as the previous explanatory paragraphs at the bottom of the page – they were deliberately de-emphasised in this summary because they elaborated on in an accompanying paper from Council officials and so did not need to be front and centre of our summary.
Key skills
Data visualisation, idea development, design (PowerPoint and Adobe Suite)
Outputs
An A3: a visual representation of key findings
Key staff members

Kira Oldfield
Senior Policy Consultant